University of Waterloo Weather Blog
Posted 11:00 am April 28, 2008 Top of the page
Where are those April Showers?
Today's rain is the first significant rainfall we have had since the 11th.
Posted 11:00 am April 24, 2008 Top of the page
Between April 17th and 23rd we had daily high temperatures over 20°C every day.
That was the longest streak of over 20 degree days in April since 1990, when there were 9 in a row.
Posted 4:15 pm April 17, 2008 Top of the page
We have a winner!
Congratulations to
Kimi Noguchi
who correctly guessed that the first time the UW weather station would go above 20 degrees
would be at 4:00 pm on April 17th!
In second we have
Stephen Drew
and in third
Carrie Warner
Posted 11:00 am April 14, 2008 Top of the page
There was also quite a diversion between the forecasted high for last Friday.
Environment Canada 6.0°C
CKCO 7.0°C
Weather Underground 7.0°C
The Weather Channel (USA) 8.3°C
The Weather Network (Can) 12.0°C
National Weather Service (USA) 13.3°C
CNN (accuweather.com) 13.3°C
In the end it only got up to 5.4°C on Friday, so it looks like Environment Canada was the winner that day.
Posted 5:00 pm April 11, 2008 Top of the page
What a difference across southern Ontario on Friday afternoon.
Here were the
temperatures at 4 pm:
Windsor 21°C
(Tornado Watch)
Sarnia 22°C
(Tornado Watch)
London 18°C
Waterloo 5°C
Toronto 5°C
Posted 3:00 pm April 7, 2008 Top of the page
Today is now the warmest day we have had in 2008, surpassing January 8th.
We hadn't seen a day that warm since October 31st of last year!
Today is forecasted to be even warmer!
And when it got up to 11.6°C this past Sunday, it got me thinking about the last time we had
a weekend that was that warm?
The answer: you have to go back to Saturday, November 3rd when it was 12.9°C.
Posted 9:00 am April 1, 2008 Top of the page
Weather station
summary
for
March 2008:
Max Temperature: 10.0 °C
Min Temperature: -23.4 °C
Average Daily High: 0.7 °C
(3.3 °C)
Average Daily Low: -8.8 °C
(-5.8 °C)
Total Precipitation: 60.0 mm
(70.6 mm)
(Values in brackets are
the 1971-2000 averages)
Read
the full weather summary
Click on the image below to see the monthly chart:
Posted 1:00 pm March 26, 2008 Top of the page
Believe it or not, last year at this time we had a high of 21.3 °C and crowned a winner in the
weather station contest.
Although we really aren't doing all that bad as will still be within a few degrees of the
average high for the day.
Posted 2:00 pm March 21, 2008 Top of the page
Weather station
summary
for
Winter 2007/2008:
Max Temperature: 13.3 °C
Min Temperature: -23.4 °C
Average Daily High: -0.7 °C
(-1.5 °C)
Average Daily Low: -8.7 °C
(-9.9 °C)
Total Precipitation: 268.9 mm
(189.3 mm)
(Values in brackets are
the 1971-2000 averages)
Read
the full weather summary
Click on the image below to see the monthly chart:
Sign
up to get the
monthly weather station
summary by e-mail
Posted 11:00 am March 13, 2008 Top of the page
With the forecasted warmer temperatures and rain, it might be interesting to keep an eye
on the local river and reservoir levels in the next few weeks.
Here are some graphs from the GRCA monitoring network:
Laurel Creek
Shand dam
Posted 11:00 am March 10, 2008 Top of the page
Snowfall update for the March 7-8 storm:
Between 6:00 pm Friday and 8:00 am Saturday : 6 cm
Between 8:00 am Saturday and 2:00 pm Saturday: 10 cm
Between 2:00 pm Saturday and 5:30 pm Saturday: 9.5 cm
Between 5:30 pm Saturday and 10:00 pm Saturday: 11.0 cm
Between 10:00 pm Saturday and 8:00 am Sunday: 1.0 cm
Posted 11:00 am March 9, 2008 Top of the page
A new record!
Snowfall this season
(up to 8:00 am March 9th)
246.0 cm
We have now seen the most snow of any snowfall season, beating the previous record of
245.3 cm in 1923-1924.
Posted 3:00 pm March 7, 2008 Top of the page
What is the record snowfall in KW?
You would think that this would be an easy question, unfortunately there are three official Envrionment Canada measurement stations within KW and they all give different results.
Here are the stations, along with when their years of operation, the season of maximum snowfall, and the amount of the maximum snowfall:
Waterloo-Wellington Airport
(1970-today)
1983-1984
221.6 cm
Waterloo WPCP
(1962-2000)
1983-1984
275.8 cm
Kitchener
(1915-1977)
1923-1924
245.3 cm
So on the surface it would seem that 275.8 cm is the record. However, I was a bit suspicious of the two Waterloo stations being so different and I did a bit of digging into the numbers.
If there had consistently been more snow at the WPCP station I could have lived with it. But the total winter snowfall from both of these stations is very close for 25 years except for that particular winter season. See the comparison here.
I then looked at the 83-84 season in detail and again the daily snowfall amounts at the two stations match very well throughout the entire winter except for the last two weeks of December when the WPCP station reports 87.6 cm compared to the Waterloo-Wellington airport that had 41.2 cm.
Here are the other nearby stations during December of 1983 showing the amount of snow in the final two weeks of December and in brackets the amount for all of December:
Waterloo-Wellington Airport
41.2 (74.4)
Waterloo WPCP
87.6 (122.9)
Cambridge Galt MOE
71.0 (91.0)
Cambridge-Stewart
74.0 (82.0)
Elmira
46.0 (113.0)
Elora Research Station
26.6 (52.8)
Preston
36.6 (67.6)
Preston WPCP
24.2 (51.8)
Roseville
42.0 (77.0)
Based on all of this, we are officially rejecting the 275.8 cm reading from the Waterloo WPCP station and calling the record snowfall for Kitchener-Waterloo as the winter of 1923-1924 when we had 245.3 cm.
If you have any comments on this we are trying something new, you can post your thoughts to this discussion board here: uw-weather.livejournal.com
Posted 11:30 am March 3, 2008 Top of the page
Weather station
summary
for
February 2008:
Max Temperature: 6.3 °C
Min Temperature: -21.0 °C
Average Daily High: -2.5 °C
(-2.0 °C)
Average Daily Low: -11.3 °C
(-10.7 °C)
Total Precipitation: 117.1 mm
(52.6 mm)
(Values in brackets are
the 1971-2000 averages)
Read
the full weather summary
Click on the image below to see the monthly chart:
Posted 11:00 am March 3, 2008 Top of the page
As of February 13th we have had 176 cm of snowfall so far this season (going back to last November).
This is above the average snowfall we get during the winter of 159.5 cm, but we still have a ways to go to get
to the snowfall record of 245.3 cm in 1923-1924.
Posted 10:00 am February 27, 2008 Top of the page
Happy Birthday to us!
February 27th was the ten year anniversary of when we officially opened the University of Waterloo weather station and put the associated
webpage online. See a picture from that day here and see the first mention
of the station in the daily bulletin here.
Here is how the homepage looked for about the first 6 months.
Check out the very cool graphics and the reporting of the temperature down to the thousandths of a degree.
The homepage then had a pretty static look until November of 2006
when we converted to the University of Waterloo standard webpage format.
I really want to thank all the people over the years that have helped make the station what it is today.
From the
people who made it possible in the beginning: Barry Goodison, Ric Soulis, Ellsworth LeDrew, Hoyt Graham,
and Steven Fassnacht.
To the people
who helped out along the way including Clint MacDonald, Chris Schumacher, Jayson Innes, and Wayne Jenkinson.
But most of all thanks go out to Terry Ridgway, the person who really keeps the station running and actually does the work.
Thanks also to all of you for your interest in the station,
10 years ago when I'm sure that the only hits on the webpage were the people in my office, I never would have
believed that we would now have over 5000 people looking at the site each day.
Posted 3:00 pm February 19, 2008 Top of the page
A few of the signs that warmer weather might just be coming soon:
Lots of potholes on the roads
Spring training in baseball
Longer days
and the UW weather station contest!
I can't fix the potholes but I can say that you can now enter this year's UW weather station contest.
It is the 10th anniversary of the UW weather station so we have lots and lots of prizes this year (thanks to the UWShop).
Posted 9:00 am February 13, 2008 Top of the page
As of February 13th we have had 176 cm of snowfall so far this season (going back to last November).
This is above the average snowfall we get during the winter of 159.5 cm, but we still have a ways to go to get to the snowfall record of 221 cm in 1983.
Posted 10:30 am February 12, 2008 Top of the page
The temperature of -19.6°C on the morning of February 11th was the coldest temperature we have seen since
March 7, 2007.
While you have to go back to January 22, 2005 to find a windchill that was lower than the -28.7 also recorded that morning.
Posted 10:30 am February 7, 2008 Top of the page
Our finaly tally was 26.5 cm of snow for February 6th.
Posted 10:00 am February 7, 2008 Top of the page
Between February 1st and the 6th we had 59.6 mm of precipitation at the UW weather station.
That's more than the average of 52.6 mm for the entire month of February in just the first 6 days.
Thanks to Nathan E. for pointing that out.
Posted 11:30 am February 1, 2008 Top of the page
Weather station
summary
for
January 2008:
Max Temperature: 13.3 °C
Min Temperature: -18.7 °C
Average Daily High: -0.3 °C
(-3.8 °C)
Average Daily Low: -7.3 °C
(-11.0 °C)
Total Precipitation: 91.7 mm
(64.4 mm)
(Values in brackets are
the 1971-2000 averages)
Read
the full weather summary
Click on the image below to see the monthly chart:
Sign
up to get the
monthly weather station
summary by e-mail
Posted 10:30 am January 30, 2008 Top of the page
On the morning of January 30th, the temperature dropped from 8.1°C at 2:15 am to -10°C at 8:15 am.
Posted 9:30 am January 9, 2008 Top of the page
I have recieved a few e-mails about the 40+ mm of precipitation over the last 24 hours.
We have had two days with higher precipitation (59.2 mm July 16, 2005 and 47.0 mm July 12, 2006) at the UW weather station.
But those are midnight to midnight totals so we can't make a direct comparison, the breakdown for last night was 10 mm on the 8th and 33.4 mm on the 9th,
which isn't as impressive as the 24 hour total.
Posted 11:00 am January 8, 2008 Top of the page
As per the UW weather station policy of only recognizing records at a minimum monthly time scale, here are the current highest temperatures during the month of January:
UW Weather Station (1999-2008)
Jan 13, 2005 14.9 °C
Jan 8, 2008 13.3 °C
Jan 7, 2008 12.9 °C
Jan 3, 2004 12.5 °C
Waterloo-Wellington Airport (1970-2000)
Jan 14, 1995 14.2°C
Jan 15, 1995 14.1°C
Environment Canada Kitchener Station (1914-1977)
Jan 25, 1950 13.3 °C
Jan 8, 1937 13.3 °C
Jan 15, 1932 13.3 °C
So that puts January 8th as the 4th highest January temperature in the last 90 years.
Now isn't that more satisfying then saying it was just a record for a particular day?
Posted 11:00 am January 4, 2008 Top of the page
Weather station summary
for 2007:
Max Temperature: 33.1 °C
Min Temperature: -26.8 °C
Average Daily High: 12.46 °C
(11.93 °C)
Average Daily Low: 2.48 °C
(1.73 °C)
Total Precipitation: 677.9 mm
(904.0 mm)
(Values in brackets are
the 1971-2000 averages)
Read
the full weather summary
Click on the image below to see the monthly chart:
Temperature Precipitation
Posted 12:00 pm January 2, 2008 Top of the page
Weather station summary
for December 2007:
Max Temperature: 7.0 °C
Min Temperature: -16.1 °C
Average Daily High: -0.6 °C
(-0.4 °C)
Average Daily Low: -7.7 °C
(-7.5 °C)
Total Precipitation: 86.7 mm
(71.1 mm)
(Values in brackets are
the 1971-2000 averages)
Read
the full weather summary
Click on the image below to see the monthly chart:
Posted 10:00 am December 17, 2007 Top of the page
Our final tally was 24.5 cm of snow between Saturday (15th) night and Sunday (16th) afternoon.
Posted 10:00 am December 3, 2007 Top of the page
Weather station summary
for November 2007:
Max Temperature: 13.5 °C
Min Temperature: -10.9 °C
Average Daily High: 5.0 °C
(5.9 °C)
Average Daily Low: -2.5 °C
(-1.6 °C)
Total Precipitation: 83.7 mm
(82.3 mm)
(Values in brackets are
the 1971-2000 averages)
Read
the full weather summary
Click on the image below to see the monthly chart:
Posted 9:00 am December 3, 2007 Top of the page
Precipitation summary for this past weekend:
Snow on Saturday night
14.5 cm
Rain on Sunday night
19.0 mm
Posted 9:30 am November 24, 2007 Top of the page
When the temperature got down to -10.9°C on the evening of November 23rd, it was the coldest temperature we have
seen since March 8th.
Posted 9:00 am November 22, 2007 Top of the page
The total precipitation from Nov 21 was 30.3 mm, making it the wettest day since August 7th.
But it didn't manange
to surpass the 33.4 mm we saw on May 15th, which was the wettest day of the year so far.
Posted 10:00 am November 1, 2007 Top of the page
Weather station summary
for October 2007:
Max Temperature: 30.0 °C
Min Temperature: -2.1 °C
Average Daily High: 17.8 °C
(13.2 °C)
Average Daily Low: 8.4 °C
(2.9 °C)
Total Precipitation: 47.6 mm
(67.1 mm)
(Values in brackets are
the 1970-2000 averages)
Read
the full weather summary
Click on the image below to see the monthly chart:
Posted 11:00 am October 22, 2007 Top of the page
There is a forecast low below zero for Thursday morning. If this happens it will be the first time
it will have gone below zero since the spring.
No matter when it occurs it will be the latest first frost day of the fall in the
9 and a half years of the UW weather station, as our previous record was in 2005 when it didn't
happen till October 20th.
Going back even further there was never a later first frost date between 1970-2000 at the Waterloo-Wellington
Airport station.
For the Kitchener station that ran from 1914-1977, they report a first frost day of November 5th in 1970
(by the way this conflicts with the Waterloo-Wellington Airport station) and in various other years
it didn't happen till late October.
But this year will still be the latest first frost in some 35 odd years.
Posted 9:30 am October 9, 2007 Top of the page
In the end, three of the days of the long weekend are now the warmest days we have ever seen during the month of Ocotober.
It was also the warmest long weekend of 2007!
Who could have predicted that at the beginning of the year?
Here are the (updated) highest temperatures we have ever recorded at the weather station during the month of October:
Oct 8, 2007 30.0 °C
Oct 5, 2007 29.0 °C
Oct 6, 2007 28.7 °C
Oct 1, 2002 27.3 °C
Oct 4, 2005 26.9 °C
Oct 5, 2005 26.7 °C
Oct 4, 2002 25.8 °C
And going further back:
Waterloo-Wellington Airport
Oct 2, 1971 29.4 °C
Environment Canada Kitchener Station (1914-1977)
Oct 6, 1946 31.1 °C
The jet stream also took an interesting turn on Sunday cutting right across southern Ontario.
As a result the high for London was 28.3°C but in Kitchener-Waterloo it was only 20.5°C.
Posted 11:00 am October 1, 2007 Top of the page
Weather station summary
for September 2007:
Max Temperature: 32.3 °C
Min Temperature: 2.3 °C
Average Daily High: 23.3 °C
(20.0 °C)
Average Daily Low: 10.5 °C
(8.3 °C)
Total Precipitation: 36.8 mm
(87.5 mm)
(Values in brackets are
the 1970-2000 averages)
Read
the full weather summary
Click on the image below to see the monthly chart:
Posted 9:30 am September 26, 2007 Top of the page
The temperature of 30.1°C we saw on September 25th was the highest temperature
we have ever seen during the fall in the history of the weather station.
(It will probably also be the highest temperature we see until next year)
Posted 10:30 am September 17, 2007 Top of the page
On Sunday, September 16th the temperature got down to 2.3 °C at 3:30 am.
This was the coldest temperature we have seen since May 21st.
Posted 10:00 am September 12, 2007 Top of the page
On Sept 11th the temperature dropped 6 degrees in the half hour between 7 pm and 7:30 pm.
Posted 9:00 am September 4, 2007 Top of the page
Weather station summary
for August 2007:
Max Temperature: 33.1 °C
Min Temperature: 7.9 °C
Average Daily High: 25.5 °C
(24.7 °C)
Average Daily Low: 14.3 °C
(12.6 °C)
Total Precipitation: 62.6 mm
(87.0 mm)
(Values in brackets are
the 1970-2000 averages)
Read
the full weather summary
Click on the image below to see the monthly chart:
Posted 3:00 pm August 21, 2007 Top of the page
There has been lots of talk in the media about the melting polar sea ice.
Here is an image of the most recent (Aug 27th) ice cover compared to 2005 (the year
that previously had the record for the lowest amount of sea ice).
Note the lack of ice cover throughout the entire northwest passage.
Also note that as well as there being a lot less ice, the ice that is there is much thinner.
Posted 10:30 am August 8, 2007 Top of the page
It was a long time coming, but we finally got the long steady rain we needed to make the area farmers and gardeners happy.
With 32.2 mm of rain on August 7th, it was the second highest precipitation total in one day all year!
However, the record for 2007 is still May 15th when we got 33.4 mm.
Posted 10:00 am August 2, 2007 Top of the page
We recorded a temperature of 33.1 °C at 5:15 pm on August 1st.
This was the hottest temperature we have seen since exactly one year before on August 1st of 2006 at 4:30 pm when it was 33.5 °C.
Posted 10:00 am August 1, 2007 Top of the page
Weather station summary
for July 2007:
Max Temperature: 31.5 °C
Min Temperature: 7.5 °C
Average Daily High: 25.2 °C
(26.0 °C)
Average Daily Low: 13.4 °C
(13.8 °C)
Total Precipitation: 50.8 mm
(92.9 mm)
(Values in brackets are
the 1970-2000 averages)
Read
the full weather summary
Click on the image below to see the monthly chart:
Posted 11:00 am July 3, 2007 Top of the page
Weather station summary
for June 2007:
Max Temperature: 32.0 °C
Min Temperature: 6.5 °C
Average Daily High: 25.7 °C
(23.6 °C)
Average Daily Low: 12.7 °C
(11.3 °C)
Total Precipitation: 26.6 mm
(80.0 mm)
(Values in brackets are
the 1970-2000 averages)
Read
the full weather summary
Click on the image below to see the monthly chart:
Posted 10:00 am July 3, 2007 Top of the page
This past Sunday was the coldest Canada Day we have had in the 9 year history of the weather station!
The high temperature was only 19.3 °C.
How does that compare to past Canada Days?
See for yourself:
| 1998 |
23.5 °C |
0 mm |
| 1999 |
24.5 °C |
0 mm |
| 2000 |
26.2 °C |
0.9 mm |
| 2001 |
21.3 °C |
0 mm |
| 2002 |
33.0 °C |
0 mm |
| 2003 |
28.1 °C |
0 mm |
| 2004 |
26.7 °C |
0 mm |
| 2005 |
25.3 °C |
0 mm |
| 2006 |
26.6 °C |
0.8 mm |
Posted 2:30 pm June 22, 2007 Top of the page
Weather station summary
for Spring 2007:
Max Temperature: 31.1 °C
Min Temperature: -8.7 °C
Average Daily High: 16.7 °C
(15.9 °C)
Average Daily Low: 5.2 °C
(4.4 °C)
Total Precipitation: 168.4 mm
(219.5 mm)
(Values in brackets are
the 1970-2000 averages)
Read
the full weather summary
Click on the image below to see the monthly chart:
Posted 11:30 am June 19, 2007 Top of the page
The rain that it looks like we are going to get today will end a 10 day streak without signficant precipitation.
The grass around town is starting to look very brown.
Posted 10:00 am June 9, 2007 Top of the page
Weather station summary
for May 2007:
Max Temperature: 30.0 °C
Min Temperature: -1.1 °C
Average Daily High: 20.4 °C
(18.9 °C)
Average Daily Low: 7.2 °C
(6.6 °C)
Total Precipitation: 75.7 mm
(76.9 mm)
(Values in brackets are
the 1970-2000 averages)
Read
the full weather summary
Click on the image below to see the monthly chart:
Posted 10:00 am May 22, 2007 Top of the page
It seems that there is always at least one cold day during the Victoria Day long weekend.
This year the temperature only got up to 13.3 C on the Sunday (about 7 degrees below average) and of course the stiff wind didn't help matters either.
In fact it was a cold Victoria Day weekend in 2002 that got me started on the idea of making the monthly weather graphs:
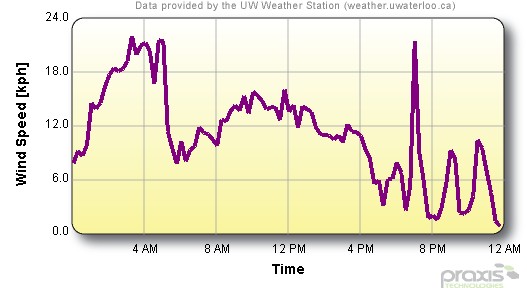
Posted 10:00 am May 16, 2007 Top of the page
Well that was a pretty good storm we had last night and you can really see the storm coming through on the weather station charts.
The temperature dropped about 10 degrees in the span of 2 hours.
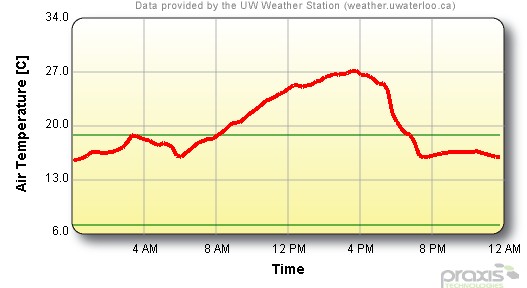
In the 15 minutes between 6:45 and 7:00 pm we got 13 mm of precipitation.
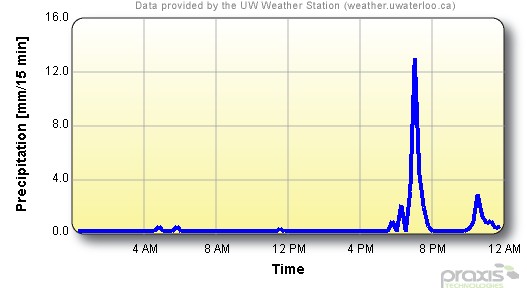
And during that same period we had our maximum average wind speed of 21 km/h (remember that is the average of the wind speed over the 15 minute period.
Posted 10:00 am May 9, 2007 Top of the page
Take a look to the left and you will notice that for the first time since the inception of the UW weather station there is now a fourth menu option.
Yes, after many requests we have finally worked out a system to display graphs of the recent weather readings!
Take a look and send us your comments.
Thanks to Wayne Jenkinson who did the programming for the weather graphs
Read the full story about the graphs here.
Posted 3:30 pm May 7, 2007 Top of the page
The temperature at the UW weather station went below 0°C on the morning of May 7th.
If it turns out to be the last frost day of the
season, it would be pretty close to average date of the last frost which is May 6th.
But I don't know if I would put out those annuals just yet.
Posted 11:00 am May 1, 2007 Top of the page
Weather station summary
for April 2007:
Max Temperature: 22.9 °C
Min Temperature: -8.7 °C
Average Daily High: 8.9 °C
(11.4 °C)
Average Daily Low: 0.3 °C
(0.6 °C)
Total Precipitation: 70.7 mm
(76.9 mm)
(Values in brackets are
the 1970-2000 averages)
Read
the full weather summary
Click on the image below to see the monthly chart:
Posted 11:00 am April 23, 2007 Top of the page
I don't think anybody can complain about the past weekend, but it looks like we will be returning to more or less average temperatures for the rest of the week.
Posted 11:00 am April 20, 2007 Top of the page
Looks like sometime either today or this weekend we will break 20 C for the first time since March 27th.
Posted 6:30 pm April 17, 2007 Top of the page
We haven't had a warmer than average day since April 4th.
Before we break this streak, we are going to have more than 2 weeks of below average temperatures.
Combine that with only 2 days where it hasn't rained in April and you get a dreary start to the Spring.
Posted 11:00 am April 2, 2007 Top of the page
Weather station summary
for March 2007:
Max Temperature: 21.3 °C
Min Temperature: -22.5 °C
Average Daily High: 4.0 °C
(3.5 °C)
Average Daily Low: -5.0 °C
(-5.6 °C)
Total Precipitation: 56.7 mm
(70.6 mm)
(Values in brackets are
the 1970-2000 averages)
Read
the full weather summary
Summary chart:
 Posted 11:00 am March 27, 2007 Top of the page
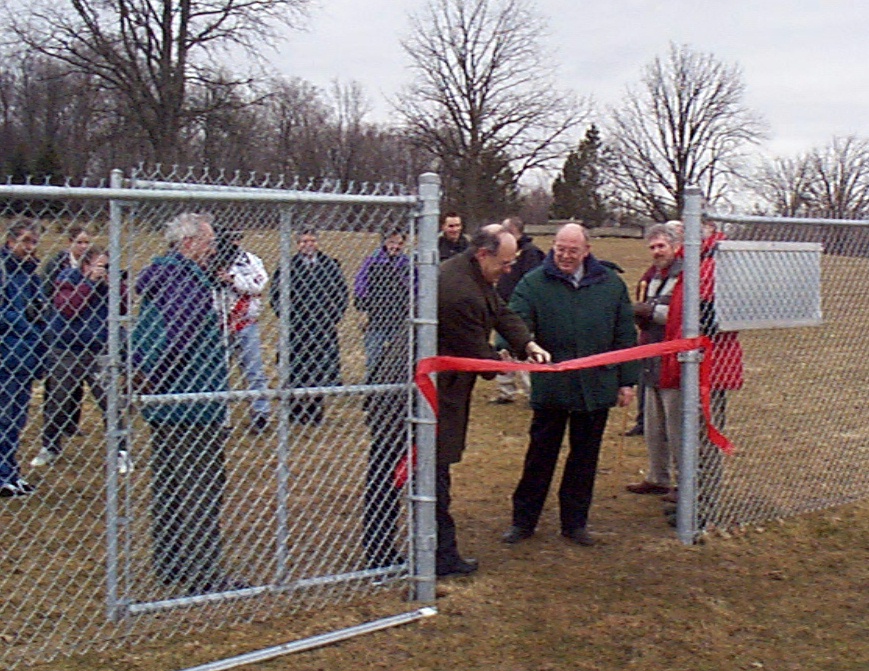
UW weather station contest winner is declared as temperature goes over 20 degrees for the first time in over 5 months
With a forecast high of only 18 degrees and a temperature of 13 degrees at noon, it really didn't look like March 26th was going to be the winning date in the annual UW weather station contest (the contest is guess when the temperature will first go over 20 degrees at the weather station). But with the thermometer rising about 4 degrees an hour after lunch the temperature hit exactly 20 degrees at 3:15 pm.
Unlike the past couple of years, when the temperature has flirted close to 20 degrees for a few days before going over, this was the first warm day we had seen in a long time. The previous warmest day of this year was only 11.5 C and March 26th turned out to be the warmest day since Oct 3rd of last year. This year's winning date falls within the range of past winning dates (March 8 to April 19th).
This year's winner is Tom Duffney whose guessed the exact time of 3:15 pm. Shawn M was second with a guess of 3:00 pm (the reason he gave for the time and date of his guess was : "Al Gore and An Inconvenient Truth"). They will both be receiving an digital indoor/outdoor thermometer from Ontario Seed Hardware for being so good at predicting the weather.
And it wasn't just me that was checking the weather station website during the afternoon as we had about twice the number of hits of an ordinary day by 3:30 pm (our usual daily average is 4000 hits a day but we had about 8000 hits for the day when the winning time came in).
At 927 entries, it was the highest number of people to enter the contest, we look forward to holding the contest again next year and as always hope for an earlier winning date.
Here they are picking up their prizes from Mike Copland, the manager of the Ontario Seed Home Hardware.
Tom:

Shawn:

Posted 2:00 pm March 21, 2007 Top of the page
Weather station summary
for Winter 2006/07:
Max Temperature: 12.1 °C
Min Temperature: -26.8 °C
Average Daily High: -1.7 °C
(-1.4 °C)
Average Daily Low: -9.4 °C
(-9.8 °C)
Total Precipitation: 162.8 mm
(185.6 mm)
(Values in brackets are
the 1970-2000 averages)
Read
the full weather summary
Summary chart:
Sign
up to get the
monthly weather station
summary by e-mail
Posted 10:00 am February 20, 2007 Top of the page
What a difference a day makes!
Temperature at 6 am
Feb 19: -26.2 °C
Temperature at 6 am
Feb 20: 2.1 °C
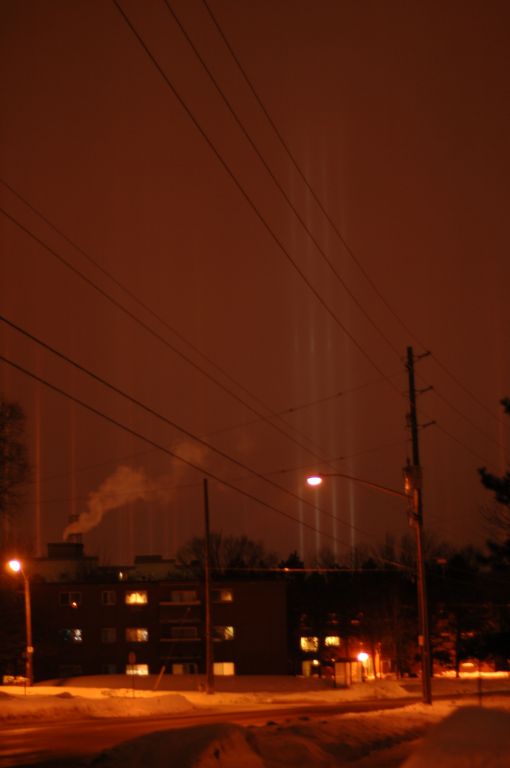
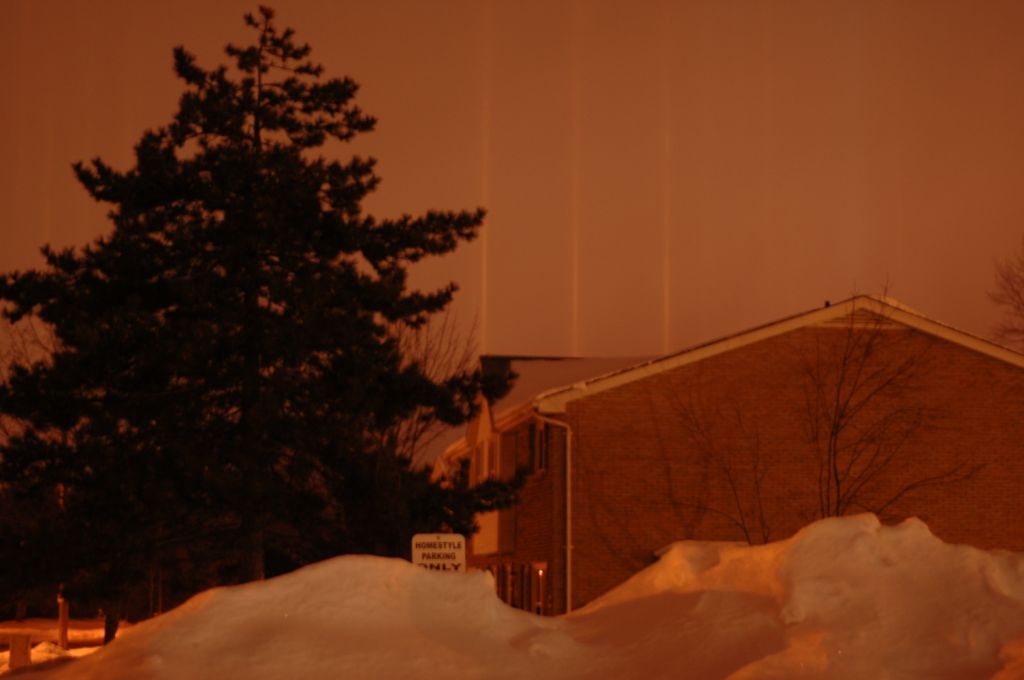
Posted 10:00 am February 19, 2007 Top of the page
For anybody who was outside on Feb 18 between about 8 and 10 pm you might have seen a neat atmospheric phenomena called a light pillar. This is when ice crystals make it appear that any light source on the ground extends into the sky. See more information about light pillars here.
The following pictures were taken that night by Alex Frakking:
Light Pillar Photo 1
Light Pillar Photo 2


