In mid 1997, the equipment for the Climatological Station was provided to the University of Waterloo by Meteorological Service of Canada , a division of Environment Canada, for educational and research purposes. The station began operation in February of 1998.
Frequently Asked Questions (FAQ)
Media Coverage of the Weather Station
Weather Station Location
Instrumentation Specifications
Q: Who runs the weather station?
A: The Eric D. Soulis weather station is operated by the Waterloo Hydrology Lab in the Department of Civil and Environmental Engineering at the University of Waterloo. The coordinator of the weather station is Frank Seglenieks under the supervision of Dr. Ric Soulis, while technologist Marc Sobon is the one who does the equipment maintenance (ie. the real work). We also get occasional help from various current and former graduate students and staff in the Hydrology lab such as Terry Ridgway, Jayson Innes and Wayne Jenkinson.
Q: Where is the station located?
The station is located beside Columbia Lake on the north campus of the University of Waterloo in Waterloo, Ontario, Canada. The coordinates are 43d 28' 25.6" N and 80d 33' 27.5" W and the elevation is 334.4 m.
Q: Why was this site chosen?
After studying 5 possible locations for the station, it was determined that the site on the north campus adjacent to the greenhouse was the most preferable. It is not ideal as there are trees to the east and south of the station that are closer than recommended by Environment Canada. However, it was the most favorable site that was available on lands owned by the University of Waterloo.
Q: What is the difference between the weather station and the micrometeorological station?
A: The "weather station" is the central tower at the weather station that houses the sensors that are displayed on the main UW weather station homepage. The "weather station" has all the equipment of a "Class A" Environment Canada synoptic weather station, however we don't meet some of the other criterion to be considered a "Class A" weather station (ie. we haven't been around for 30 years and we allow tours of the station). We have also added two micrometeorological towers with various experimental instrumentation such as driving rain gauges and instruments to study boundary layer processes.
Q: How is the station powered?
A: The station has a small 12 Volt battery that is recharged using a solar panel (there is no line power going to the station). So far the solar panel has maintained an adequate charge in the station's battery even during the cold dark days of winter.
Q: What is Dew point temperature?
A: Look here.
Q: What does the precipitation reading mean during the winter?
A: In the winter the precipitation is still measured in mm, this number is referred to as the snow water equivalent. This is the number of mm of water that would result if the amount of snow that fell were melted into liquid water. Which by the way is exactly how the Belfort and Geonor gauges measure precipitation, the gauge consists of a bucket on a weigh scale, as more precipitation falls into the bucket the scale will go down. We put a mixture of anti-freeze and oil in the bucket to melt the incoming snow and stop evaporation.
The Belfort and Geonor gauges collect precipitation in a bucket that is connected to a weigh scale, as more precipitation falls the bucket gets heavier. The mm of precipitation during a given time period is the difference in the Belfort reading during that time period. ie. if the reading is 157.9 at 9:00 am and 160.2 at 10:00 am, then 2.3 mm of precipitation fell during that hour. However, sometimes you may notice the Belfort and Geonor readings actually going down, this is usually caused by the wind shaking the gauge (we have them secured them down as best we can, but all Geonor gauges shake a bit in a strong wind).
To convert between snow water equivalent and amount of snow the common way to do it is to assume that there would be 10 times the amount of snow as snow water equivalent. For example, if 1 mm of snow water equivalent falls during the winter it would be approximately equivalent to 10 mm or 1 cm of snowfall. But note that this 10 to 1 radio is just an approximation and depends on the type of snow that is falling and your location.
We have also instigated an official measurement of daily snowfall (OK its not really that official, it's really the snowfall in my backyard), see the record of daily snowfall here .
Q: Sometimes it is cold but the windchill is not on the webpage, the same thing in the summer when the humidex isn't on all the time, why not?
A: Although we use the standard Environment Canada formulas for calculating windchill and humidex, it is a judgment call whether or not to report these values. For instance, if the wind speed is below about 4 km/h the windchill equivalent temperature (WET) is actually higher than the actual temperature. We have decided to report windchill if the WET is less than the actual temperature and the WET is less than zero degrees Celsius. The criterion for humidex is to report it if the humidex is greater than 2 degrees above the actual temperature and the humidex temperature is above 20 degrees Celsius.
Q: Why don't you record windchill and humidex in the data archive?
A: Both windchill and humidex are calculated parameters (their values are derived from measured values) hence interested parties can calculate them using data that are in the archive. This allows individuals to use their own formulas for calculating the parameters (there are many versions of the equations) and it reduces the size of the data archive.
Q: Is the weather station Barometric Pressure actually surface pressure or is it adjusted to a certain temperature or altitude?
A: The weather station pressure is corrected for elevation, it is standard meteorological practice to report pressure as sea-level pressure rather than surface pressure. To translate the sea-level pressure readings from the weather station to surface pressure you can subtract 3.9836 kPa.
Q: What do the "Incoming Radiation" readings mean on the main page and "Reflected Solar Radiation" on the archive page?
A: The incoming radiation is the amount of incoming shortwave radiation between a wavelength of 0.3 to 3 micrometers, which covers most of the energy that hits the earth from the sun. So it gives you an indication if the sun is visible over the horizon or whether or not it is a cloudy day.
The device used to measure the incoming radiation is called a pyronometer and it is mounted horizontally. Readings from this sensor have been used by researchers to calculate the energy production of solar panels.
The reflected short wave radiation sensor is a pyranometer that is pointed towards the ground and thus measures the amount of solar radiation that is reflected by the ground surface.
Picture of pyronometer set up.
The amount of energy reflected by the ground is called the albedo. This can range from 0.16-0.26 for grassed areas, which means that between 16% and 26% of the energy from the sun is reflected back to the atmosphere, while the albedo can get up to 0.95 for fresh snow.
Q: How do you know when the first snow of the season occurs at the weather station?
A: It all depends on your definition of first snow of the season, during some point in October there is usually snow falling from the sky. But as we don't have a human observer at the station we can't make judgments on the weather conditions (ie. snow, fog, cloudy) we can only infer them from the other measurements. However, snow can fall when the temperature is as high as 4 degrees and rain can fall down to about -2 degrees, so you can't just look at the temperature when precipitation was falling. The current snow depth measurement device we use at the station is not reliable enough to measure the small amount of snowfall that is usually the season's first.
So the only reliable method to determine when the first snowfall of the season occurs is to wait until there is a snowfall that can be measured at 8:00 am at the official weather station snow measurement board (that is actually located in my backyard) and call that the first day of snowfall. But also consider that if there is snowfall less than 0.5 cm it is called a "Trace" amount and recorded. So everybody will have to judge for themselves when the first snow of the season has occurred.
Q: Sometimes I hear that a temperature for a particular day is a "record", but you don't make note of it on your website. Why not?
A: It all depends on your definition of what constitutes a "record". Technically if a temperature is the warmest it has ever been for that particular day it could be called a record temperature. So yes a 13.3 C temperature on November 26th might be the warmest November 26th in 30 years but does that really make it special. If you work out the odds, if you have a 30 year record, on average a daily temperature record could be expected about 12 times a year or about once a month, in my opinion not that special.
So when the media calls us at the UW Weather Station, we never say that it is a record if it is only the warmest temperature for that day, for us it has to be the warmest for a particular month or season.
There are three factors that probably all contribute to the lower wind speed values at the UW weather station:
1.) The wind speed readings at the UW weather station are averaged over 15 minutes and thus we lose the wind gusts. I'm not sure over what time period the Environment Canada website averages their wind speed but this can have a large effect on the readings.
2.) Another consideration is that the UW weather station is relatively low compared to its surroundings and thus may be somewhat shielded from the wind.
3.) The wind speed readings at the UW weather station are taken at 3 m whereas the standard wind speed height is 10 m. To get the 10m wind speed you have to multiply the 3m wind speed by 1.5.
Q: What is the weather station contest and when does it start?
Every year to mark the birthday of the weather station (February 27th for those who want to send cards), we hold a contest where people guess the date and time that the weather station will first hit 20 degrees. We arbitrarily chose 20 degrees, but it seems that it is temperature that a lot of people associate with the first real day of spring.
The contest entry period is usually in the latter half of February, the contest is first announced on the weather station homepage and then gets mentioned on various media outlets in town, so keep your eyes and ears open to find out when you can put in your guess.
There are usually prizes for the winners of the UW weather station contest and even more importantly they get a spot in the UW weather station contest Hall of Fame.
Q: On the monthly summary graphs, why do the extreme values sometimes cross into the average range? Logically this shouldn't happen.
The reason is that the averages are based on the Waterloo Wellington Airport data from 1970-2000 while the extreme values are for the 10 or so years of data we have from the UW weather station.
It is the standard in the meteorological field to use 30 years of data to create these averages. It is thought that this amount of time will eliminate the effects of short term fluctuations.
Q: At some times during the year you show the amount of precipitation in the last 15 minutes, 1 hour, and 24 hours, while at other times there is no 15 minute reading. Why does this happen?
When precipitation falls as rain we measure it using what is called a Tipping Bucket gauge, this gauge is very good at measuring small amounts of precipitation (down to 0.2 mm). When we are using this gauge, we put the 15 minute data on the website.
However, the Tipping Bucket cannot measure frozen precipitation, so when that type of precipitation is falling we measure it using a Weighing Bucket gauge (see the FAQ question: What does the precipitation reading mean during the winter? for a more detailed description of this gauge).
Unfortunately, the readings from the Weighing Bucket gauges tend to "bounce" around a bit and they are not as responsive as the Tipping Bucket type so we only report the 1 hour and 24 hour accumulations.
In the fall of 2002 we installed a device on top of the Micrometeorology tower south of the main station to measure the incoming precipitation from different directions.
See a picture of the installation hereUnfortunately, as the tower is south of the main station and the device is rather large there are times of the year when it will cast a shadow on the incoming solar radiation gauge. That is the reason for the dip in the solar radiation readings.
This effect is seen from about January 9th to March 7th and then again from October 5th to November 21st.
At the moment we have no solution to this problem, however we are examining whether or not the device will be kept at the station.
If you have any other questions please e-mail them to Frank Seglenieks at weather@civmail.uwaterloo.ca
2008 |
Recording of interview on the CBC during the show "Ontario Morning" on March 11, 2008 Recording of interview on Dave FM on March 10, 2008 Recording of interview on Dave FM on February 25, 2008 Recording of interview on Dave FM on March 10, 2008 Recording of interview on Dave FM on June 18, 2008 Recording of interview on the CBC during the show "Ontario Morning" on September 25, 2008 |
2007 |
Recording of interview on Dave FM on January 2, 2007 Recording of interview on Dave FM on February 13, 2007 Recording of interview on Dave FM on March 20, 2007 Recording of interview on Dave FM on April 16, 2007 Recording of interview on Dave FM on October 31, 2007 |
2006 |
on Dave FM on February 23, 2006 Recording of interview on Dave FM on December 13, 2006 |
2005 |
| on 570 News on February 21, 2005 on 570 News on February 22, 2005 on the CBC during the show "Ontario Morning" on February 22, 2005 |
2004 |
| on 570 News on January 16, 2004 on 570 News on February 25, 2004 on the CBC during the show "Ontario Morning" on August 12, 2004 |
2003 |
from February 25, 2003 on the show "Sturgeon in the Morning" on February 26, 2003 on the CBC during the show "Ontario Morning" on March 11, 2003 |
UTM Coordinates (Zone 17)
4813494 N - 535812 E (NAD 83)
Latitude: 43 deg 28 min 25.6 sec N (43.4738 N)
Longitude: 80 deg 33 min 27.5 sec W (80.5576 W)
Elevation: 334.4 m above sea level
The Climatological Station is located at the University of Waterloo
just west of Columbia Lake on the North side of
Columbia Street West, Waterloo, Ontario, Canada.
Top of the page
Humidex is a calculated parameter which is based upon temperature and humidity. It gives a measure of the amount of discomfort felt by the combined effect of the above two elements. We use the following formula to calculate Humidex:
Humidex = T + 5/9 * (e-10)
where:
e = vapour pressure(6.112*10^(7.5*T/(237.7+T))*H/100)
T= air temperature (degrees Celsius)
H= humidity (%)
The * symbol represents multiplication
The ^ symbol represents a value raised to another value, ie. 2^3 is 2 raised to the power of 3.
Unfortunately, windchill is not as easy to measure as Humidex. This is because it is a indication of how cold it "feels" when warm air around a human body is replaced by cold air. In October of 2001, Environment Canada came out with new formulas for wind chill that were designed to be more representative of how cold it actually feels on your face during the winter. They actually did some experiments with people walking on treadmills in chilled wind tunnels sometimes with water being sprayed on their faces. For more on how they got the new index see Environment Canada's windchill fact sheet.
To calculate windchill, the University of Waterloo Weather Station uses the official Environment Canada formula:
W = 13.12 + 0.6215 * (T air) - 11.37 * (V)^0.16 + 0.3965 * (T air) * (V)^0.16
where:
W = the wind chill index, based on the Celsius temperature scale (but note that it is expressed without units, ie. not with °C)
T air = the air temperature in degrees Celsius
V = is the wind speed at 10 metres in km/h. (Note that although 10 metres is the standard anemometer height the anemometer at the Waterloo Weather station is at 2 metres. To correct for this we use the following formula: Wind Speed at 10 m = Wind Speed at 2 m X 1.5)
The * symbol represents multiplicationThe ^ symbol represents a value raised to another value, ie. 2^3 is 2 raised to the power of 3.
Why do we now show dew point temperature on the Waterloo Weather Station?
It is part of our campaign to encourage the Canadian public to use dew point temperature as a measure of the amount of water in the air. Sure you can use relative humidity, but it's so... relative, the nature of relative humidity makes it heavily dependent on the temperature.
For example, you can have a relative humidity in the summer of 100%, but you can also have a relative humidity in the winter of 100%, as well there might be a similar relative humidity in Vancouver as there is in Waterloo, but because of the temperature difference, there is a lot less moisture in the air in Waterloo. Relative Humidity also varies throughout the day just because the diurnal temperature variation as shown in the following diagrams:
Although the relative humidities are similar for these days, the actual amount of moisture in the air was quite different as shown by the difference in dew point temperatures.
The Dew point Temperature is defined as how much the air in the atmosphere must be cooled for the air to reach saturation (when the air temperature reaches the dew point temperature water will start to condense out of the atmosphere). For 1999 the highest dew point temperature was 25.8 °C on July 4 while the lowest was -30.5 °C on January 12. To put it in more everyday terms, if the dew point temperature is greater than 20 °C at night (as happens during the summer) you will probably have trouble sleeping without air conditioning.
There are instruments to measure dew point temperature directly, these instruments use a mirror that is chilled until a light sensor indicates that moisture has formed on the mirror. Unfortunately these instruments are expensive and require a lot of maintenance.
Thus we are going to stick with calculating dew point temperature using temperature and humidity. We will use the official Environment Canada computation of dew point temperature :
Dew Point = 237.3 / ( 7.5 / ( log(RH) + (7.5 * T air ) / (237.3 + T air ) -2 ) -1 )
where:
RH = relative humidity in percent
T air = the air temperature in degrees Celsius
And just think how cool you'll be when somebody at work mentions how dry it is and you say "in fact the dew point temperature is only -10 °C which is quite dry", OK maybe not cool in a Steve McQueen, Buffy or Don Kudo kind of way but more cool in a Bill Nye, Bob McDonald, David Phillips kind of way.
Click on small picture to see full image
Station Visitors |
||
Official Weather Station Opening (Feb. 27/1998). Pictured are Dean of Engineering, Dr. David Burns and Dr. Barry Goodison of Metrological Service of Canada. |
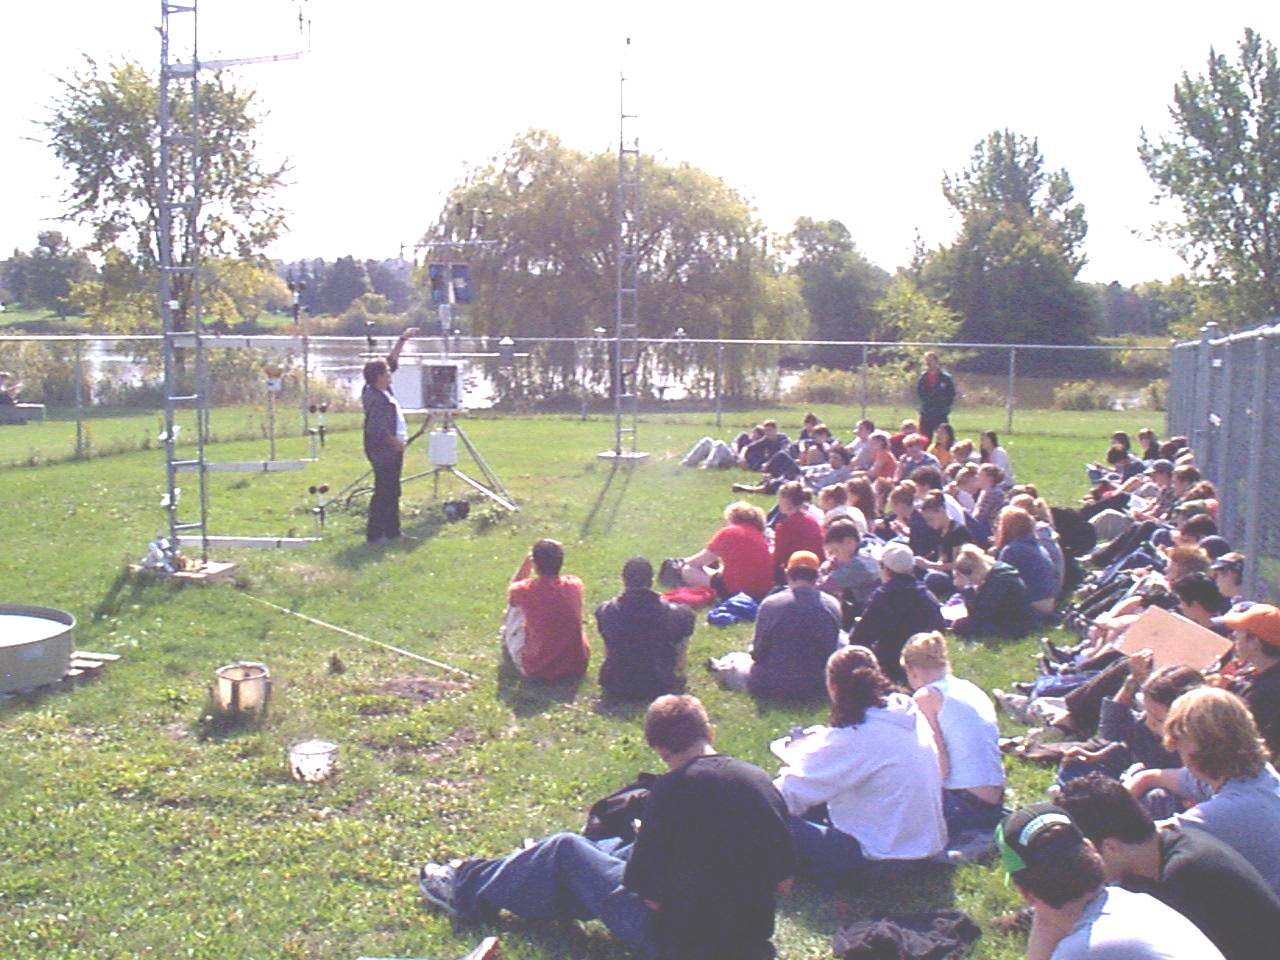
Lincoln Heights Public School Grade 5 students touring the station |
Geography 388 students from Laurier touring the station |
Mary Johnston Public School Grade 5 students touring the station |
Waterloo Mennonite Collegiate Grade 10 students touring the station October 1, 2001 |
St. Jacobs Public School Grade 5 students touring the station |
Station Equipment |
||
Tipping Bucket Rain Gauge |
Incoming and Reflected Short Wave Radiation |
Wind Speed and Direction |
Relative Humidity and Temperature |
Sonic Range Sensor (Snow Depth) |
Close up of Datalogger Enclosure |
Evaporation pan (used during Earth Science lab) |
Geonor Precipitation Gauge |
|

Frank Seglenieks
Eric D. Soulis Memorial Weather Station Coordinator
Waterloo Hydrology Lab
Department of Civil and Environmental Engineering
University of Waterloo
200 University Avenue West
Waterloo, Ontario, Canada N2L 3G1
contact us | give us feedback | University of Waterloo home page