
![]()
![]()
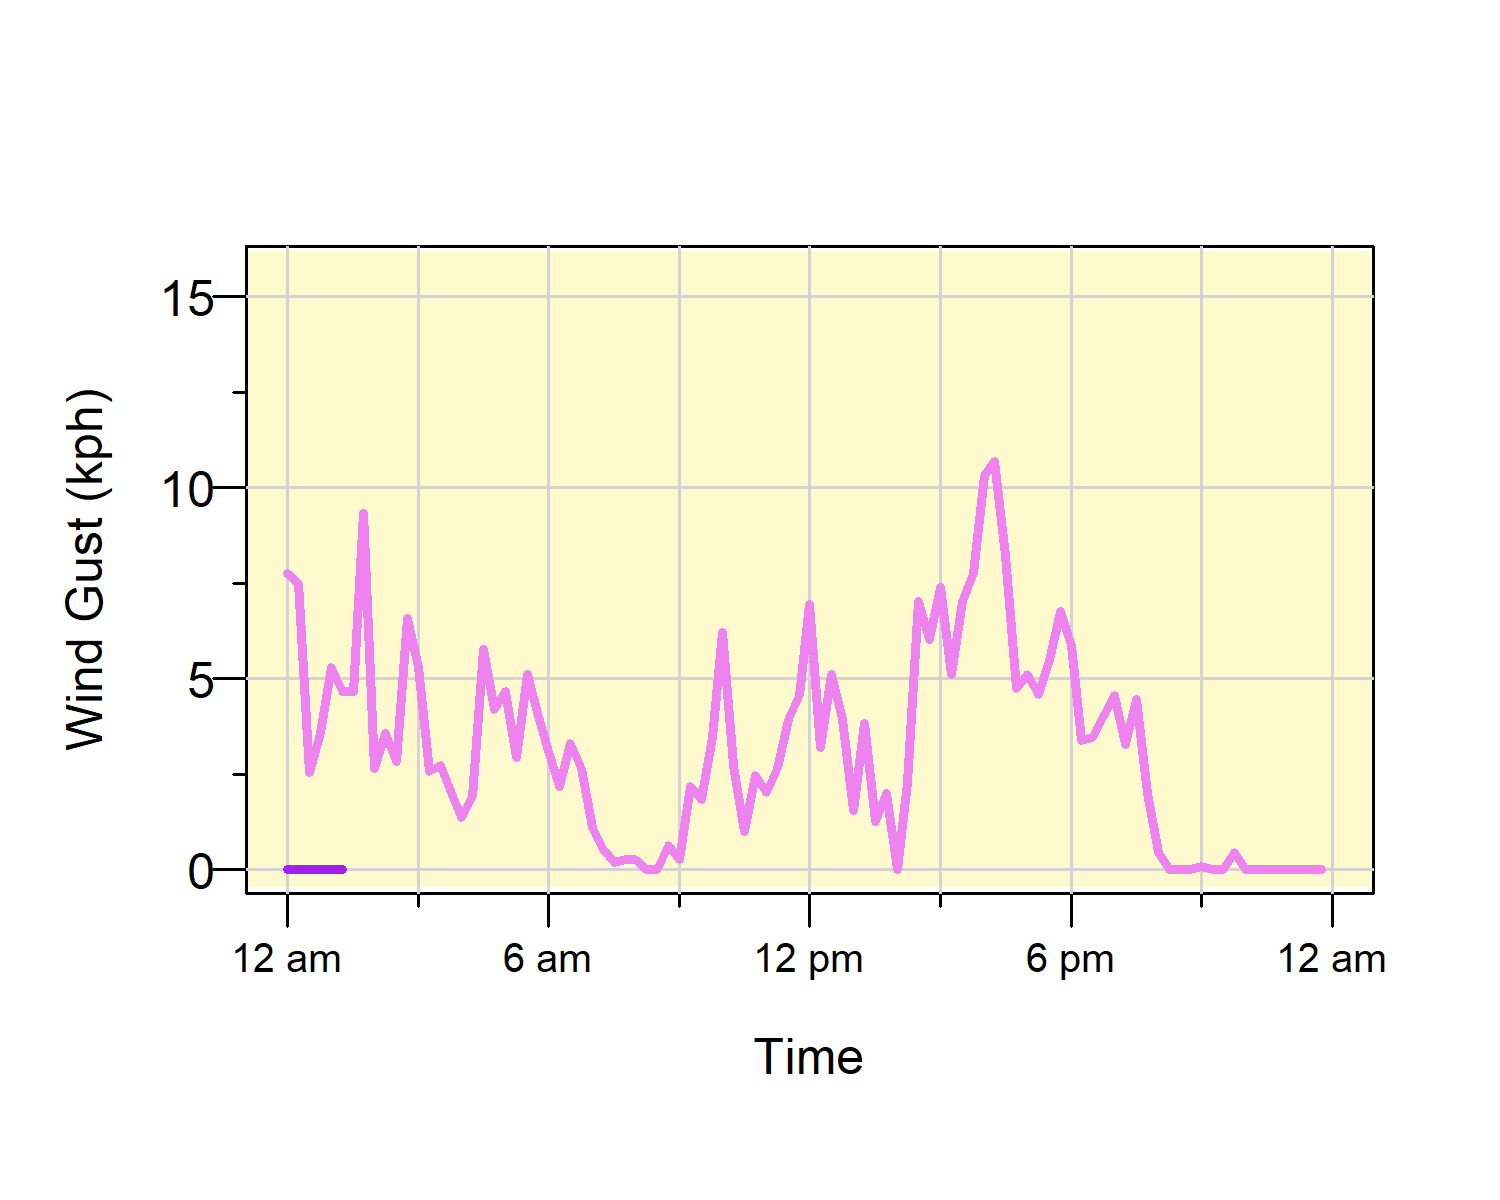
Graph Notes:
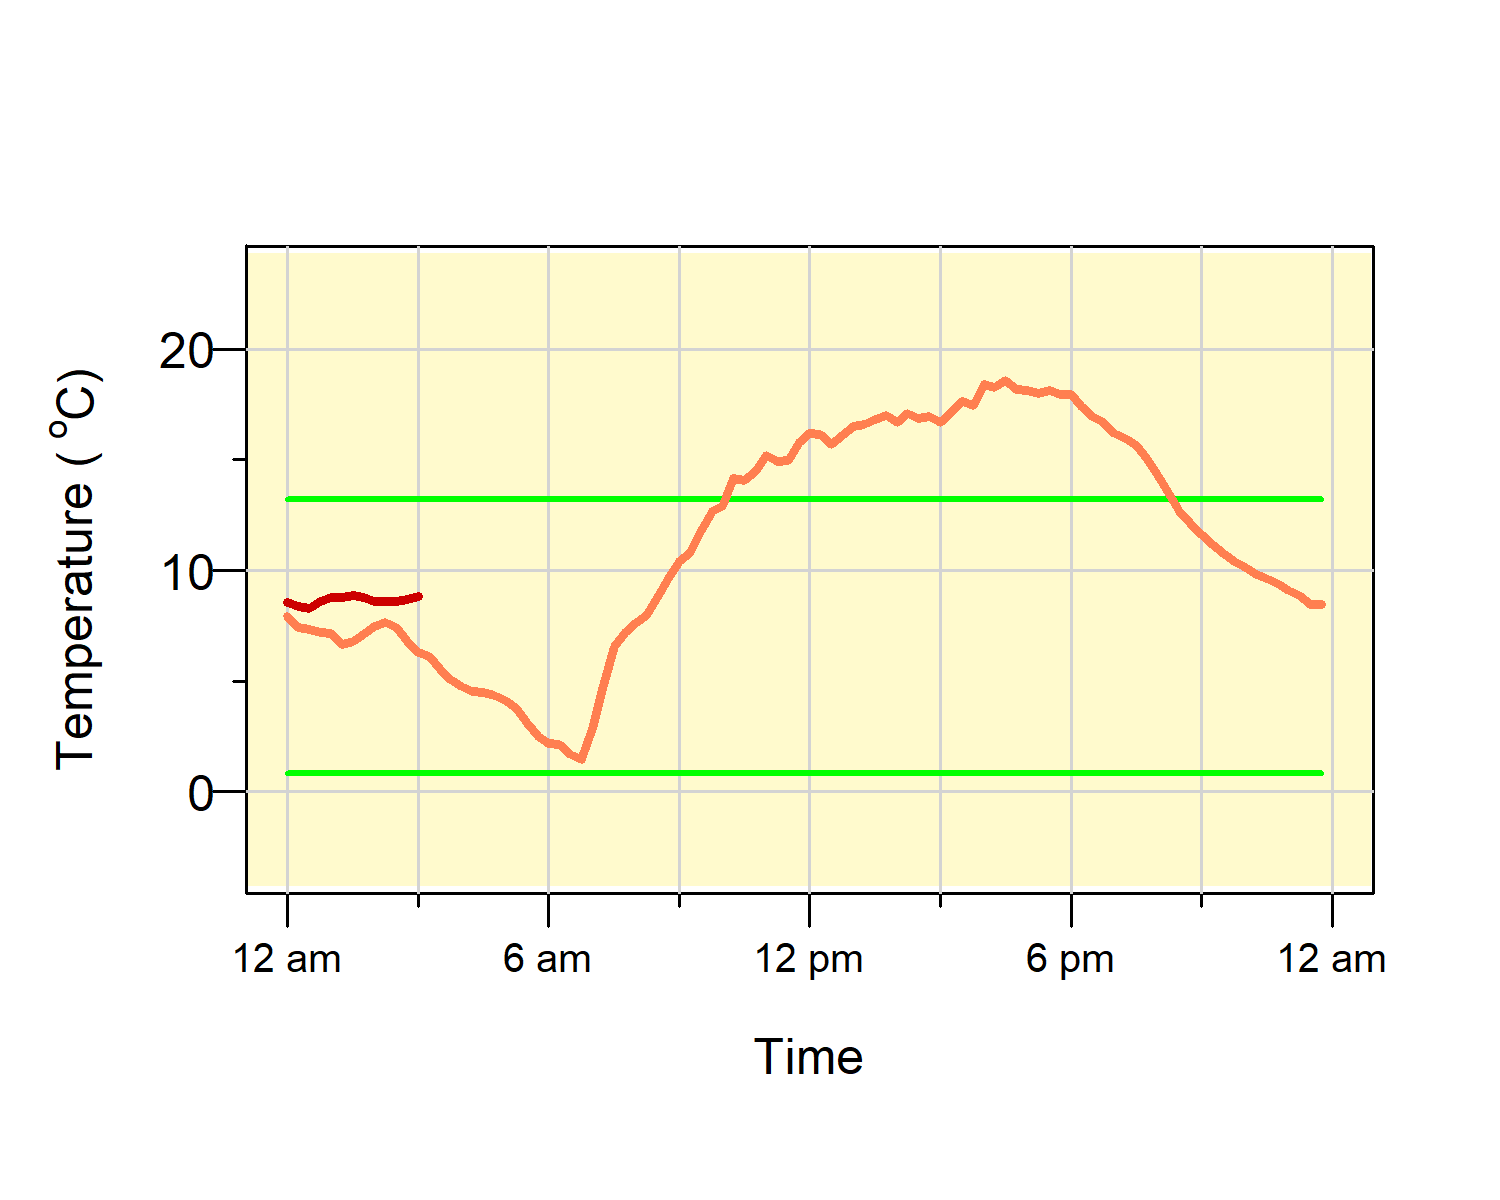
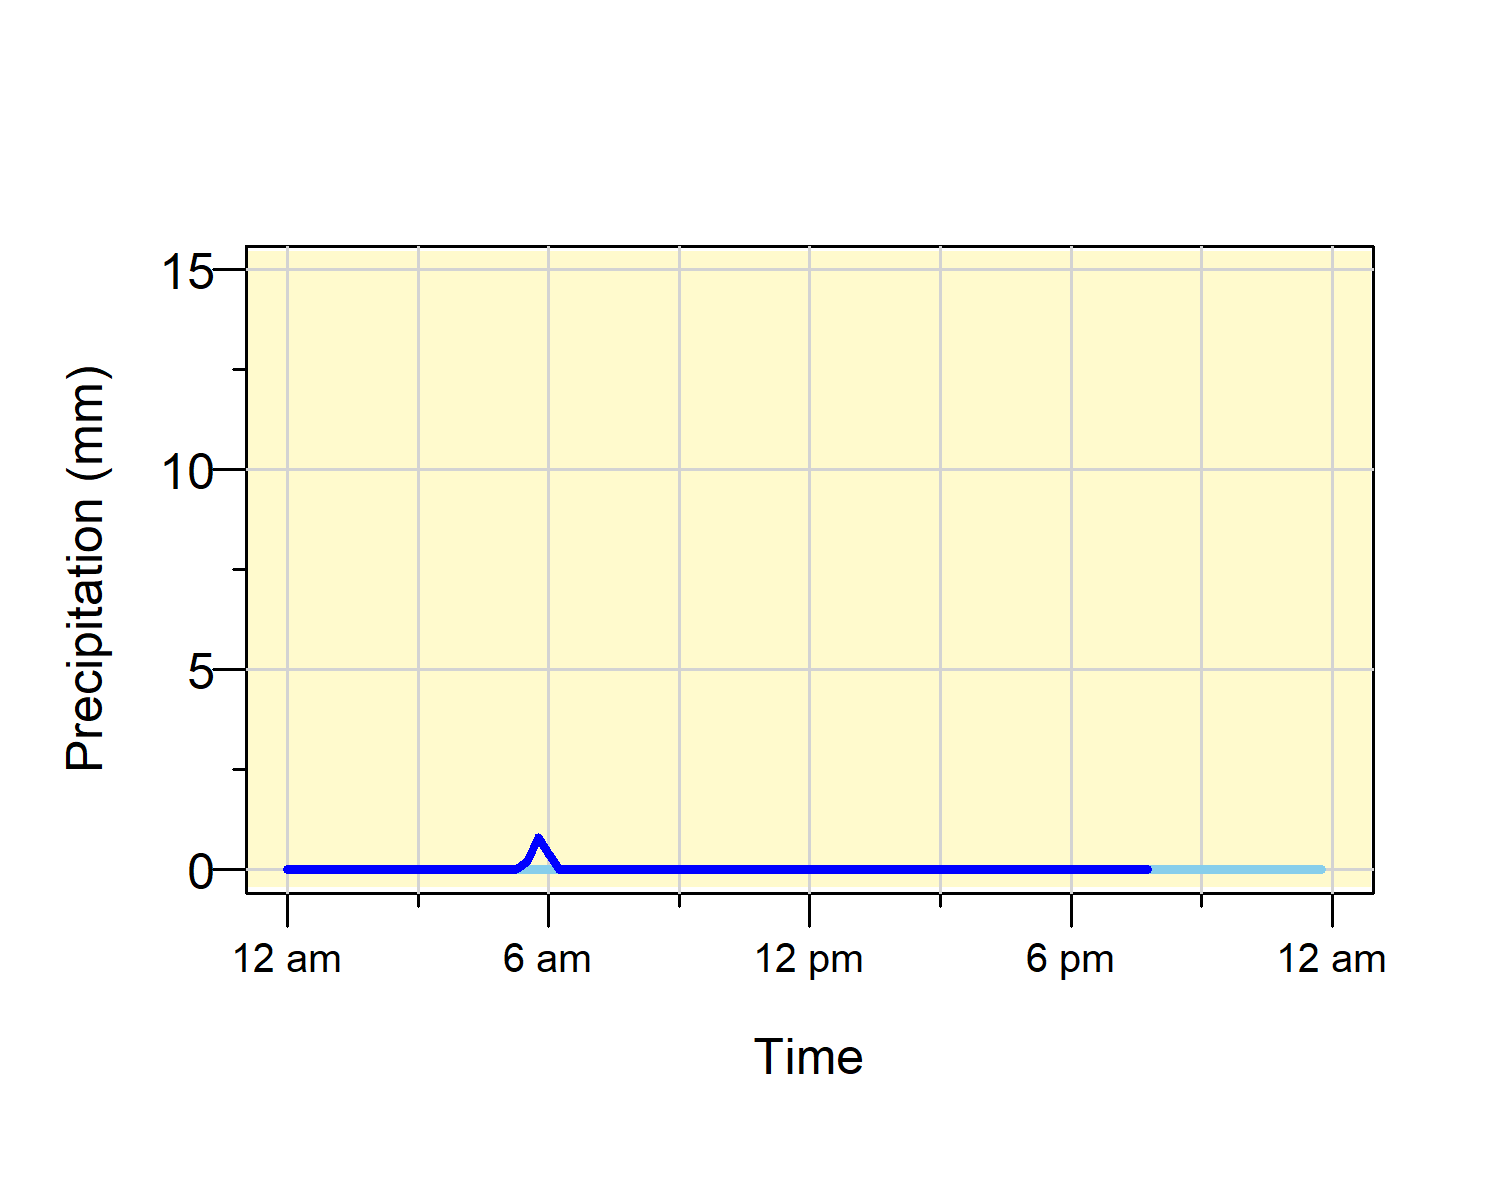
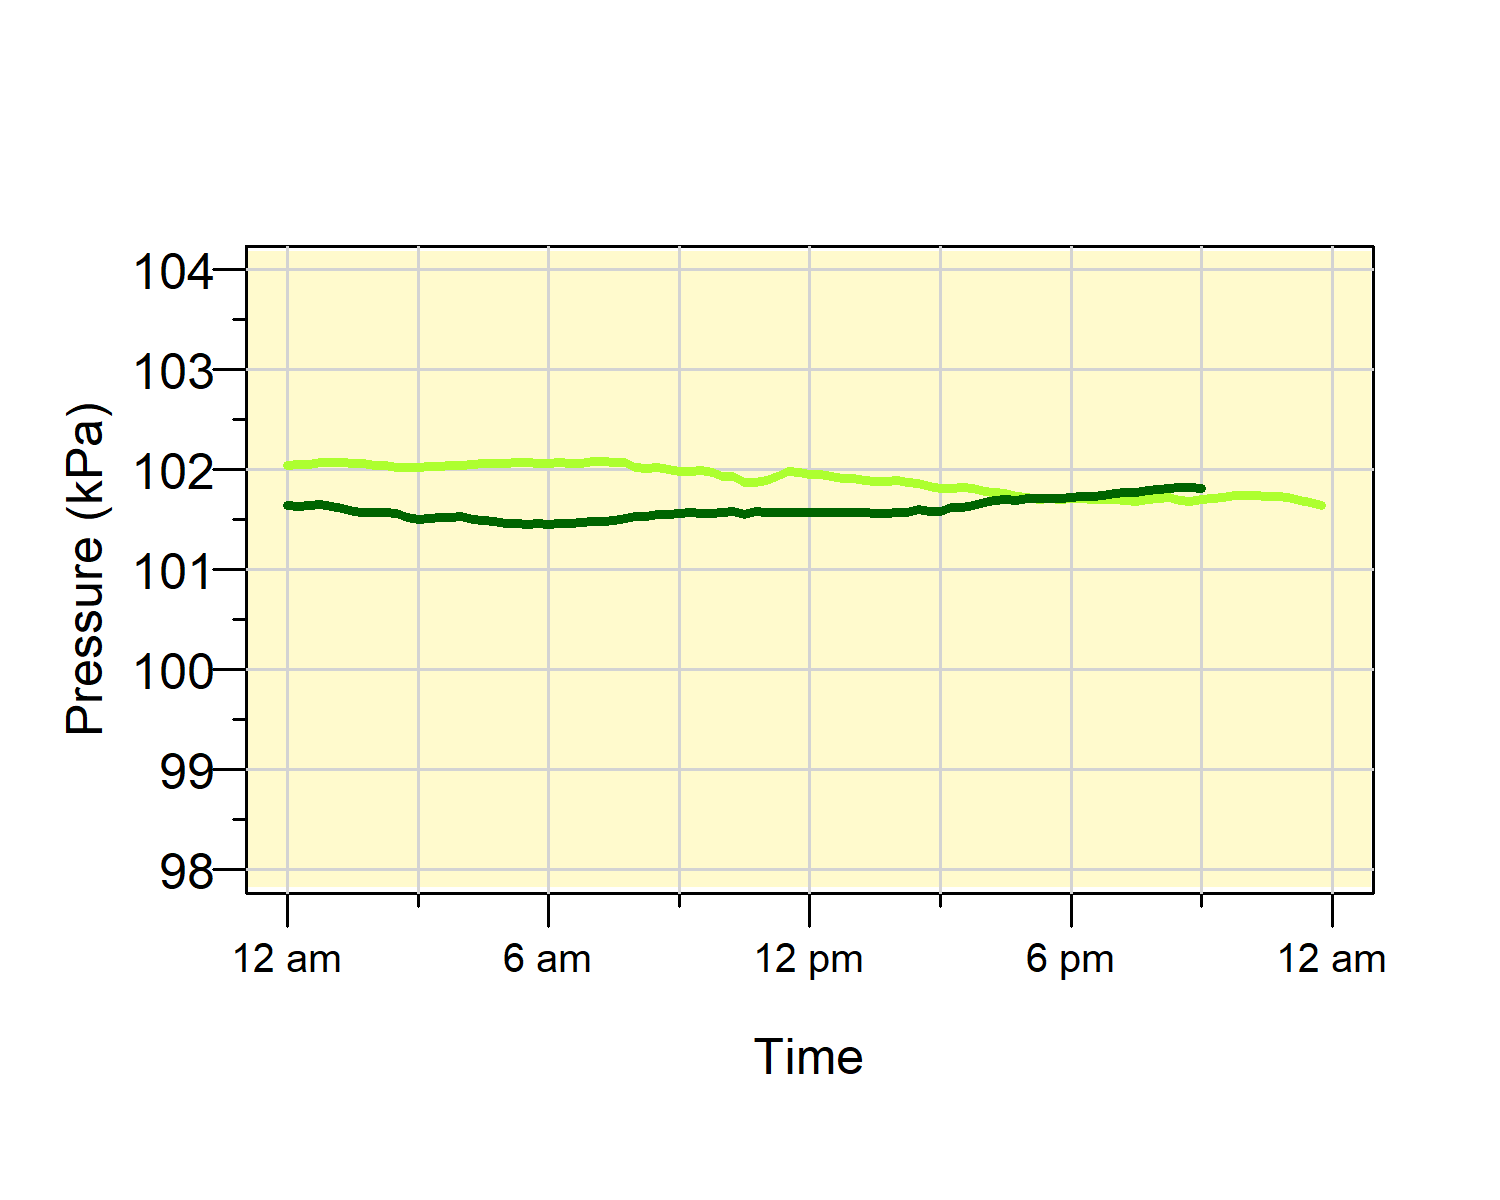
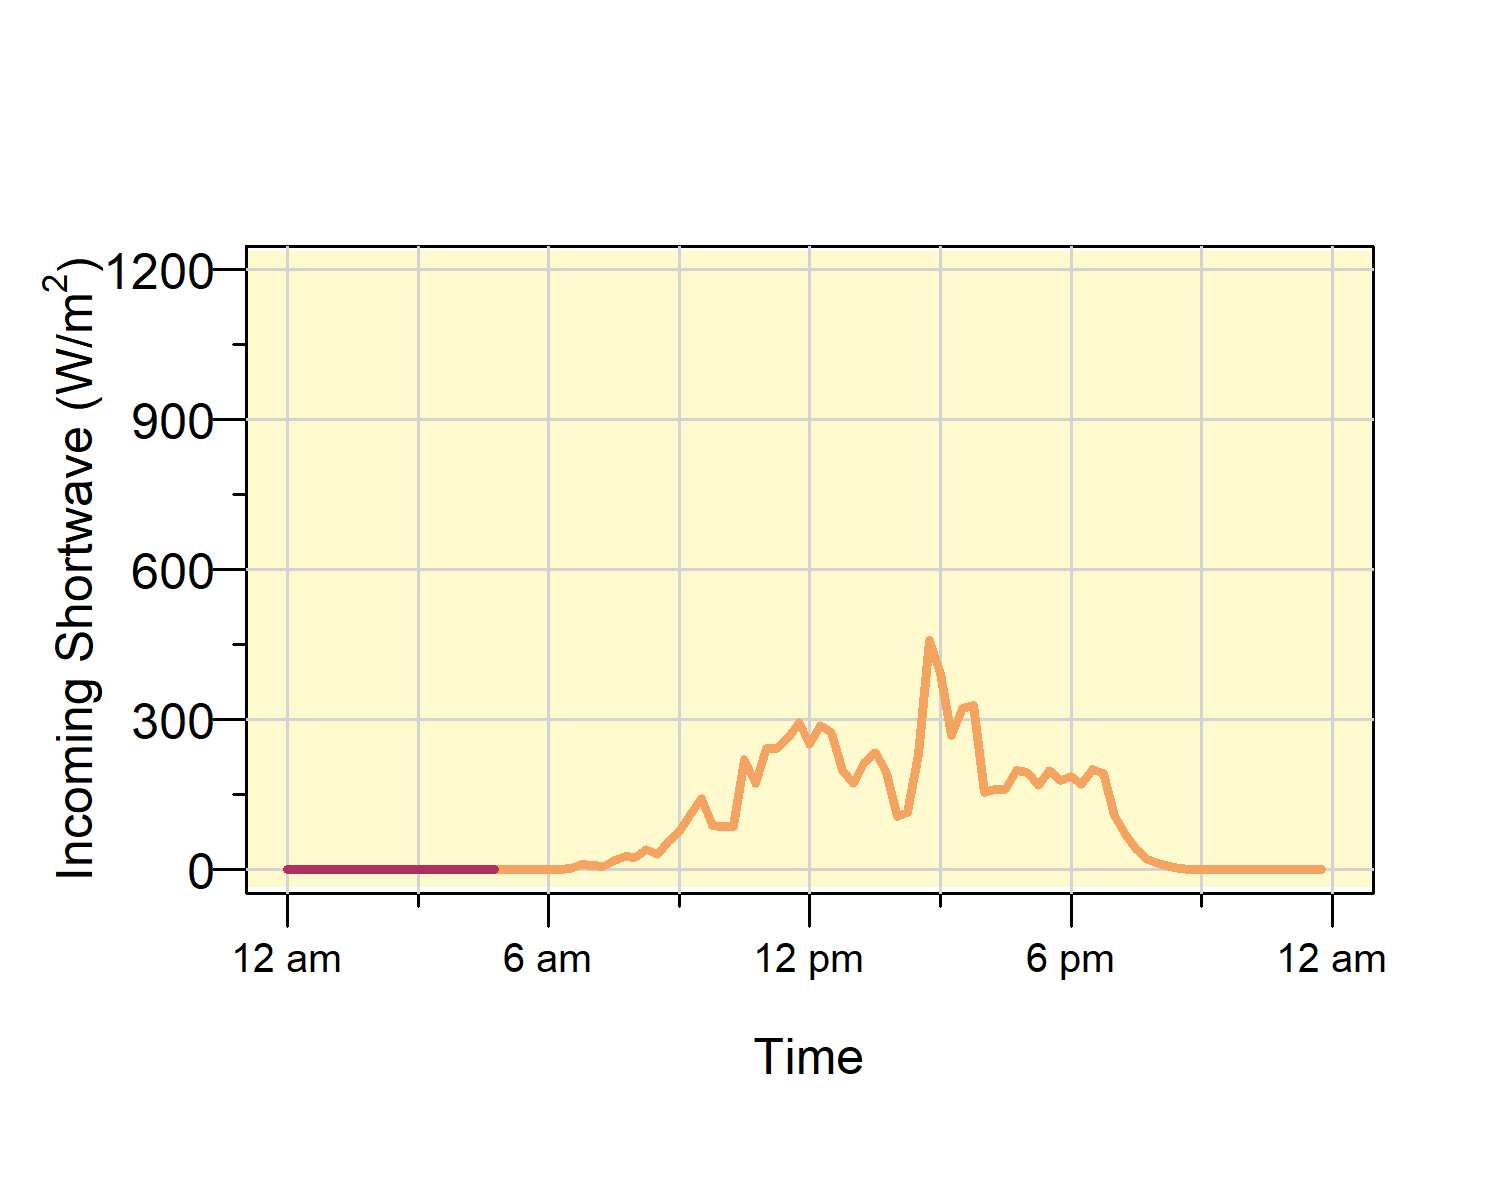
For each graph, the darker line shows the readings from today and the lighter line shows yesterday's readings.
On the temperature graph, the horizontal lines show the average high and low temperatures for the day.
On the humidex graph, the orange line is today's humidex reading and the red line is today's temperature reading. Note that the humidex graph is only shown during times when humidex readings are displayed on the main weather station page.
On the windchill graph, the blue line is today's windchill reading and the red line is today's temperature reading. Note that the windchill graph is only shown during times when windchill readings are displayed on the main weather station page.
If you use the graphs in a report or on a website, please credit The E.D. Soulis Memorial Weather Station.
Send any comments about the graphs to weather@civmail.uwaterloo.ca

Frank Seglenieks
Eric D. Soulis Memorial Weather Station Coordinator
Waterloo Hydrology Lab
Department of Civil and Environmental Engineering
University of Waterloo
200 University Avenue West
Waterloo, Ontario, Canada N2L 3G1
contact us | give us feedback | University of Waterloo home page